PHYSICAL FUNCTION ASSESSMENT TOOLS
  • HOME & SITE SEARCH
  • RESEARCH
    • Supplementary Material >
      • Comparison of Gait Models
      • Responsiveness in Stroke
      • WBB Systematic Review
      • Pusher Syndrome Balance
      • Hand Strength Review
      • Custom Step Counter
      • Grip Strength in Neurological Populations
      • Virtual Reality and Balance
      • Covid-19 and athletes
  • How-To Guides
    • INSTALLATION SOFTWARE
    • Using a Wii Balance Board for Balance and Strength Testing >
      • Setup Instructions
      • Sway
      • Strength
    • LIDAR Gait Speed
    • Low-Cost EMG
    • Smartphone Spasticity Assessment
    • Building a Load Cell Based Strength Tester
    • Convert bathroom scales into a force plate
    • Fabric Pressure Sensor
    • Joint Angle Sensors
    • Dexterity Device
  • ANALYSIS SOFTWARE
    • SeeSway - Online Balance Analysis >
      • Balance Analysis - Notes
      • Balance Analysis - Variables
    • Rate of Force Development
    • Encode and Recode Files and Folders
    • QuickDASH
    • Validity and Reliability Calculator
    • Lafeyette Rate of Force Development
  • Blog - Random Science Stuff
    • Equipment Notes
  • EDUCATION
    • SIT Physiotherapy
    • SingHealth Clinical Biomechanics Workshop
    • Introduction to 3D Gait Assessment
    • Quantitative Statistics
    • Calibration
    • Endnote Setup and Literature Searching
  • JOIN US!
  • Contact

Random Science, Data Analysis and Programming Thoughts and Tips

These are random notes for myself that are likely of little use to most - but there might be something useful somewhere here!

Intensity Charts, Heat Maps and 2D Histograms - Easy to interpret or a minefield of potential misinformation?

1/6/2021

0 Comments

 
Preparing a data analysis program for accelerometer data collected in people living with stroke my task is to analyse raw data collected from two wrist worn monitors, once on each arm. One of my collaborators was keen to replicate the 2D histogram methods in this paper:

Hayward, K. S., Eng, J. J., Boyd, L. A., Lakhani, B., Bernhardt, J., & Lang, C. E. (2016). Exploring the Role of Accelerometers in the Measurement of Real World Upper-Limb Use After Stroke. Brain Impairment, 17(1).

It seemed quite easy so I went ahead with it. However, I soon realised the problems with presenting data in this way when it is so heavily skewed. Take note of these two graphs, both of the exact same data with the only difference being the Z-axis colour bar scale and a zoom in on the Y-axis. By changing the Z-scale it makes the data look completely different, skewing in either direction depending on the settings. In the top graph it looks like vast majority of the time the person favours their left hand for movement, and that much of this occurs at bilateral magnitudes of greater than 0.05 g's. The bottom graph however shows the opposite, in that the majority of the time the person favours the right hand for movement and that almost none of the movements occur at greater than 0.05 g's.  So which one is correct?
Picture
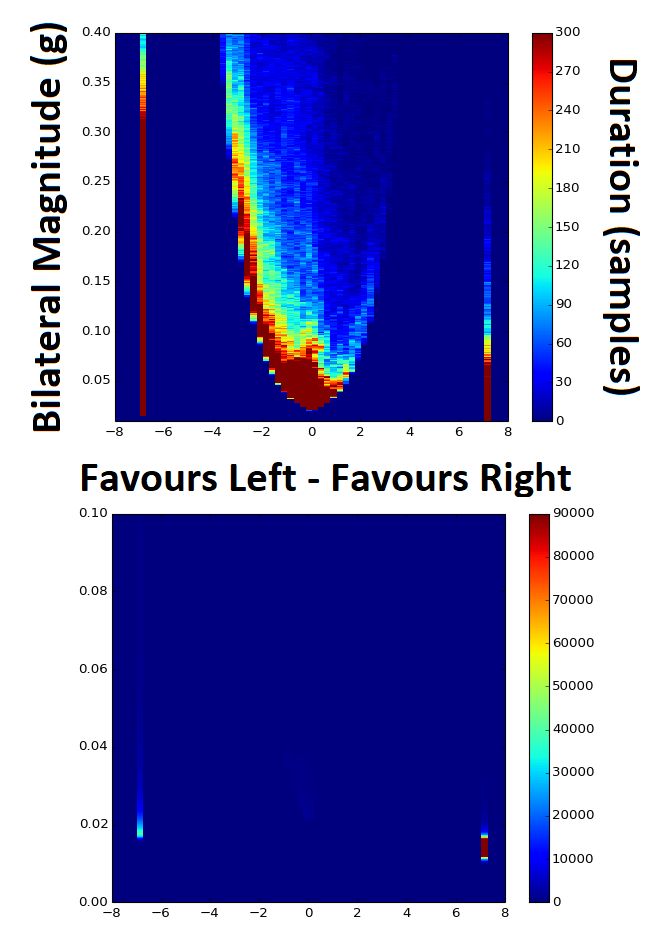
Without the 1D histogram information provided for each of the Y- and X-scale variables I now realise that these intensity charts / heat maps / 2D histograms can be a trap. The image below shows the 2D histogram with the 1D histograms for each of the axes aligned with it. This helps to tell the tale more truthfully, but adds another layer of complexity with respect to interpretation.
 
These graphs looked simple at first glance, but as often happens with research this is not always the case. There is the potential to use a log transformed Z-scale to overcome some of this problem, but this adds in another issue in that changes in colour gradient will then be non-linear as well and therefore even more difficult to interpret.      
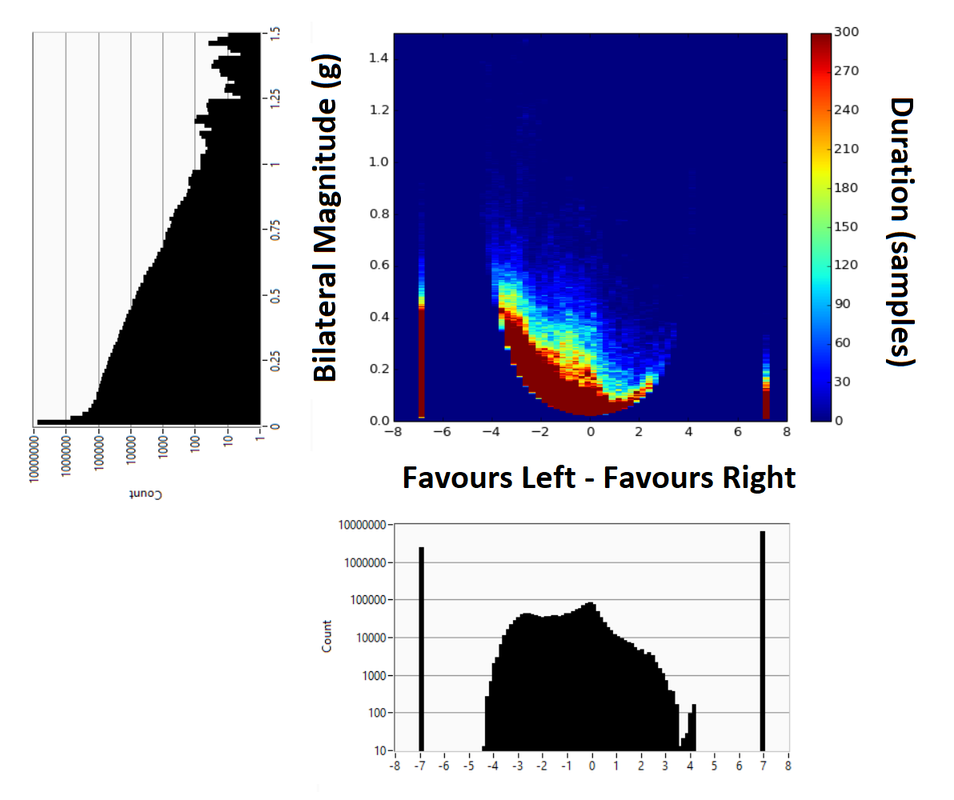
Picture
0 Comments


Leave a Reply.

    Author

    Ross Clark, PhD

    Archives

    November 2022
    August 2021
    May 2021
    January 2021

    Categories

    All
    3D Printing
    Data Analysis
    Force
    Load Cell
    Motion Analysis
    Strain Gauge

    RSS Feed

Home
About
Contact
Mailing List
Copyright © 2015
  • HOME & SITE SEARCH
  • RESEARCH
    • Supplementary Material >
      • Comparison of Gait Models
      • Responsiveness in Stroke
      • WBB Systematic Review
      • Pusher Syndrome Balance
      • Hand Strength Review
      • Custom Step Counter
      • Grip Strength in Neurological Populations
      • Virtual Reality and Balance
      • Covid-19 and athletes
  • How-To Guides
    • INSTALLATION SOFTWARE
    • Using a Wii Balance Board for Balance and Strength Testing >
      • Setup Instructions
      • Sway
      • Strength
    • LIDAR Gait Speed
    • Low-Cost EMG
    • Smartphone Spasticity Assessment
    • Building a Load Cell Based Strength Tester
    • Convert bathroom scales into a force plate
    • Fabric Pressure Sensor
    • Joint Angle Sensors
    • Dexterity Device
  • ANALYSIS SOFTWARE
    • SeeSway - Online Balance Analysis >
      • Balance Analysis - Notes
      • Balance Analysis - Variables
    • Rate of Force Development
    • Encode and Recode Files and Folders
    • QuickDASH
    • Validity and Reliability Calculator
    • Lafeyette Rate of Force Development
  • Blog - Random Science Stuff
    • Equipment Notes
  • EDUCATION
    • SIT Physiotherapy
    • SingHealth Clinical Biomechanics Workshop
    • Introduction to 3D Gait Assessment
    • Quantitative Statistics
    • Calibration
    • Endnote Setup and Literature Searching
  • JOIN US!
  • Contact