Why create a custom ankle-mounted accelerometer?
- To obtain accurate steps data in many clinical populations you need to use an ankle mounted accelerometer
- Getting one that can export raw data at the time of starting this study was not possible without spending large sums of money
- The Stepwatch Activity Monitor is by far the most validated and trusted system for use in people living with stroke, however its cost was exorbitant and large size was problematic
Creating the custom system
The Tinycircuits microcontroller platform was used as it allowed for a precise, robust, and small system to be created that could log data for the required time. The processor in this system is an ATmega328p, the accelerometer a Bosch BMA250 triaxial accelerometer with 10-bit resolution set to a measurement range of + 4g, data were collected and stored at 25Hz on an 8Gb microSD card, and it was powered by a 120mA lithium polymer battery with built in overcharge protection. The unit output was steps/day.
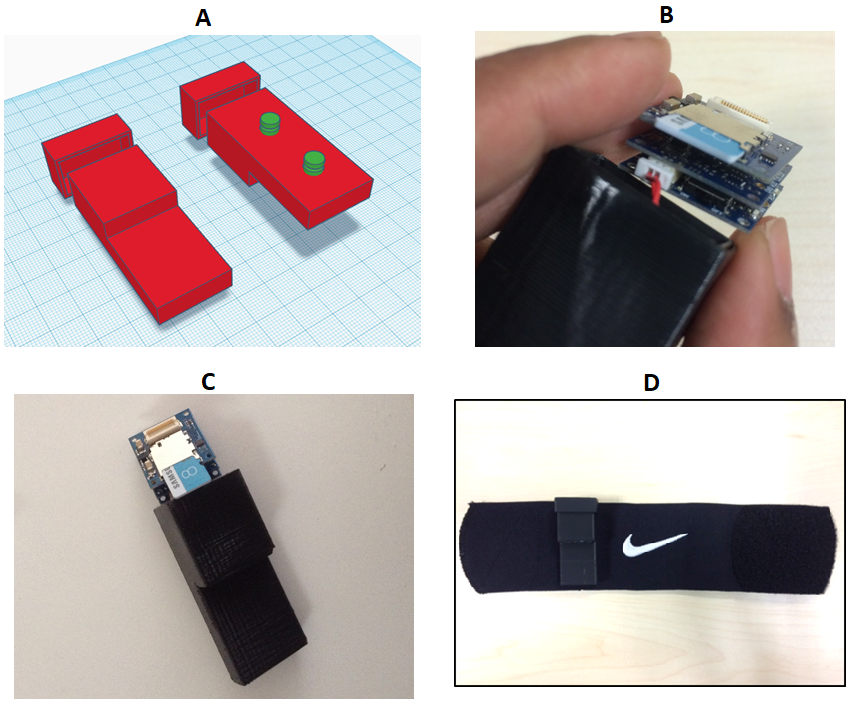
Figure 1: Description of the accelerometer system.
A) Shows the 3D print model, which encompassed the lithium polymer battery (in the extended narrow section of the unit) and the stack of 3 Tinycircuits boards. The section separate to the main body of the unit was a lid that was fastened using plastic glue. This image shows a front and rear facing view, with the green round sections on the rear facing view showing the clips that were used to connect the device to the ankle worn strap;B) The stack of three Tinycircuits boards – bottom = processor, middle = accelerometer, top = SD card. Between subjects the devise was removed and charged using an addition circuit board (not shown); C) A front facing view of the 3D printed shell (using ABS plastic) and the components about to be inserted;
D) the finished device, with the accelerometer logger attached to the ankle worn strap. Various straps were explored during the design phase of the accelerometer. The Nike™ shin guard was selected as best choice as the monitor could be easily applied with one hand to suit a hemiplegic stroke survivor.
The raw data was exported via data files into customised software (Figure 2). The customised software derives the step count by:
- High pass filtering the data for each axis at 3.125Hz using a Coiflet-5 wavelet filter to remove postural effects on the accelerometer data.
- Using an automated algorithm to identify peaks in data that were separated by no less than six and no more than 50 samples. This equates to step frequencies of between 4 and 0.5Hz. These values were chosen based on visual observation of the data, and the spatiotemporal characteristics of gait reported previously.(Nakamura, Handa, Watanabe, & Morohashi, 1988).
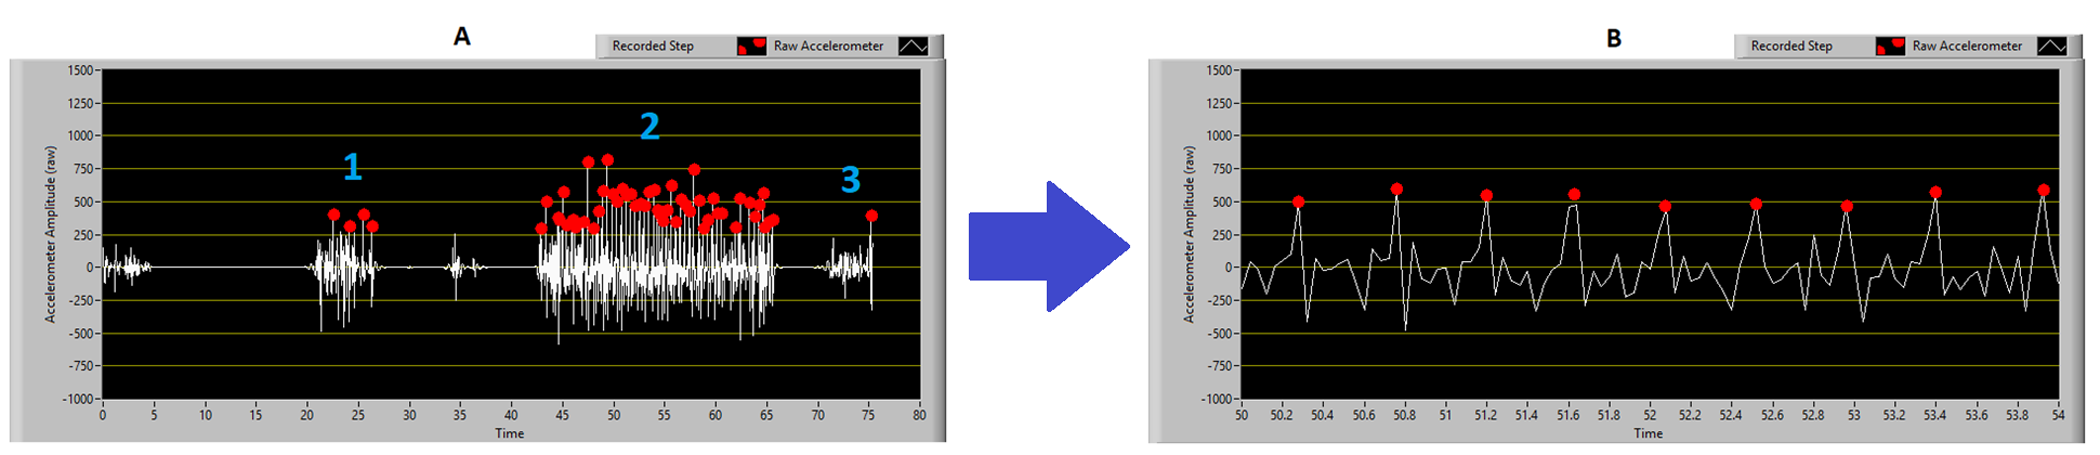
Figure 2: Customised software for data analysis.
A) The entire trial, with distinct regions for 1: donning the accelerometer, 2: the walking trial, 3: removing and switching off.
B) A close-up section of the accelerometer trace showing the raw data (white trace) and the identified steps (red dots). Note that only one axis of data is shown to aid visual interpretation.
Validating it
Participants and recruitment
Twenty participants were consecutively recruited from Bright Vision Hospital, which is a satellite inpatient rehabilitation unit of the Singapore General Hospital. Singapore General Hospital is a tertiary hospital and one of the centres for acute stroke management and multidisciplinary rehabilitation for individuals residing in Singapore. This study was approved by the SingHealth Research Ethics Committee (CIRB reference: 2015/2010).
Inclusion criteria were: a diagnosis of stroke; able to walk 10 metres with at least minimal assistance with or without walking aids; and sufficient cognition to provide informed consent. Exclusion criteria were: the presence of skin conditions or lower limb swelling that contraindicated individuals from wearing an ankle-mounted accelerometer.
Sample size calculation
The sample size in previous validation studies of commercially available activity monitors have ranged from 16-35.(George D. Fulk et al., 2014; Richard F Macko et al., 2002; Treacy et al., 2017) A convenience sample of 20 participants with varying level of mobility was considered adequate to ascertain the mean absolute error of the custom-made accelerometer compared to a hand-held counter. A percentage agreement of over 90% was reasoned as appropriate based on those previous validation studies.
Statistical analysis
Statistical analyses were conducted in IBM SPSS statistics version 22 (SPSS Inc., Chicago). Statistical significance was set at p ≤ 0.05. The percentage error of the custom-made accelerometer compared to the hand-held counter was calculated as: (1-accelerometer count/hand-held counter count) x100. This method of data collection and analysis (fixed step count, assessing error between devices) was chosen over the more common correlation-based analysis (for example a fixed walk distance or time, then correlating the calculated vs. real steps) as we deemed it to provide a much greater indicator of validity. The former approach shows the true measurement error of the device and does not rely on data heterogeneity, whereas the latter is heavily influenced by this factor. This is described in detail in Figure 3.
Procedures
The accelerometer was switched on and attached to the ankle of the participant’s unaffected lower limb. The participant was asked to walk along a level corridor at their preferred speed and using a walking aid if required for safety. Assistance was provided by the assessor if needed. The assessor counted every stride taken with the unaffected lower limb using a hand-held counter. The participant was asked to stop after 100 steps and the number of any additional steps taken after the assessor instructions to stop was recorded.
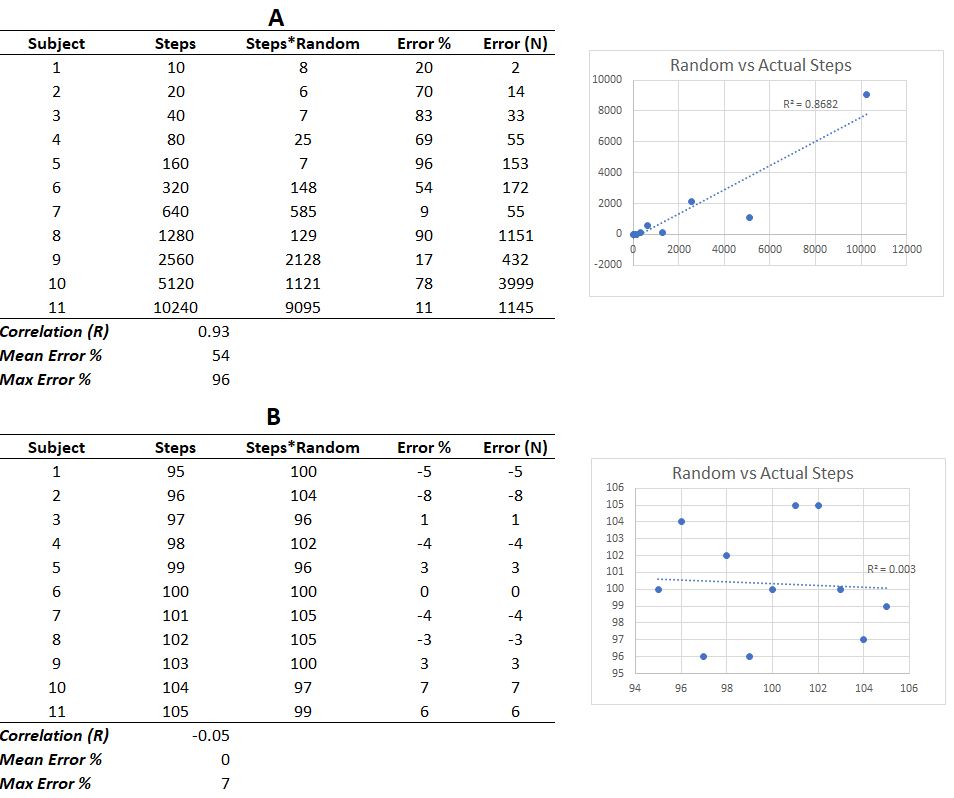
Figure 3: A comparison of validity assessment methods that incorporates heterogenous (A) and homogenous (B) data.
Both tables consist of a simulation of 11 participants data for a validation assessment that consisted of a different number of steps (column 2), the real number of steps multiplied by a randomly generated error term (column 3), and the calculation of the actual percentage error (column 4) and the actual number of missed steps (column 5). Table A represents a device with extremely high error rates, with the error term being a random number generated between 0 and 1. This reflects a device that for each step could have anywhere between a perfect (1) or no (0) chance of detecting a step. For example, if the error term was 0.2 it would be expected that the device would only detect 1 in every 5 steps. Table B represents a device with very low error rates, with the error term being a randomly generated number between 0.95 and 1.05. This reflects a device that for each step could have anywhere between a 95% (0.95) or 105% (1.05) chance of detecting a step, with the potential for slightly overestimating step count. Note that the correlation exceeds R=0.90 for Table A despite the very high fluctuations in error (mean = 54%, max = 96%) for each simulated recording. For example, Subject 8 performed 4 times as many steps compared to Subject 6 yet the device reported fewer steps performed. Despite the strong correlation, this device would not be valid. In contrast, while the correlation in Table B is poor (R=-0.05) due to the homogeneity of the data, the percentage error values are very low (mean = 0%, max = 7%) indicating that this would be a valid device.
Was it valid?
Description of participants
The characteristics of the participants are described in Table 1. Twenty participants with a median age of 57.5 years were enrolled in the study. There were 11 men and 9 women. The median NIHSS score indicates that the participants were of mild to moderate impairment. Seven participants suffered a right sided lesion, 10 had a left sided lesion and 3 participants had bilateral lesions. At the time of assessment, only half the sample were independent in their mobility with or without aids. The median gait speed across this cohort was 0.86 m/s.
Agreement between accelerometer and hand-held counter
The accelerometer only counted 3 out of the 100 steps taken for one participant who used a quad stick for mobility. This participant was removed from the analysis due to possible equipment malfunction. The custom-made accelerometer generally undercounted the steps as compared to the hand held-counter with a mean percentage error of -5.4%. The absolute error was 7 out of 100 steps taken. The percentage agreement, calculated as (custom accelerometer step count/observed step count) X 100, was 94.6% (± 8.3%). The percentage of cases that were within 10% of agreement was 94.7%. No correlation was found between gait speed and mean percentage error or the difference in the number of steps counted by the two devices.
How does this compare to commercial systems?
The custom ankle-worn accelerometer demonstrated similar error margins as the best commercially available accelerometers, when compared to steps counted using a hand-held counter, in a sample of stroke survivors undergoing inpatient rehabilitation. The challenge in this clinical group has been the accuracy of commercially available accelerometers in people with slow and asymmetrical gait speeds. The SAM and the Fitbit One worn on the unaffected ankle demonstrated a percentage agreement of 98% (±12%) and 84% (±13%) respectively.(Treacy et al., 2017) The custom accelerometer was approximately 3% less accurate than the SAM and this could be a result of the custom accelerometer being tested over a shorter distance which could have resulted in errors detecting the first and last step. However, the custom accelerometer was at least 10% more accurate than the Fitbit One.
Strengths and limitations
A low-cost, customisable accelerometer saving raw data that can be visualised if there are doubts about the accuracy of the steps count recorded is useful - but less so now that many alternative systems exist that are reasonably priced (for example the excellent Axivity AX3 system - none of us have any conflict with this company, however we use this device in our studies). Additionally, this allows for modifications to detection algorithms, if required, to increase the accuracy of measurement. However, a limitation of this validation study is that it was carried out in a clinical environment without variation to the walking surface. Also, the distance was short which could have negatively biased the accuracy results as the hardest steps to identify are ones occurring abruptly at the start and end of trials. The accelerometer was initially designed to be coupled with a high-power GPS unit to understand where stroke survivors were most active. However, technology at time of this design conceptualisation (2014) did not support this in a wearable format. With the fast evolution of activity monitors and inertial monitoring units in the commercial sphere, this is now possible.