This program allows you to collect centre of pressure sway data using the WBB, just as you would do with a force platform in a laboratory.
STANDARD DISCLAIMER FOR EVERYTHING ON THIS SITE: You use this at your own risk. Everything on this site is for example purposes only, and we take no responsibility for anything you do with any of the software or hardware we discuss or provide examples for.
STANDARD DISCLAIMER FOR EVERYTHING ON THIS SITE: You use this at your own risk. Everything on this site is for example purposes only, and we take no responsibility for anything you do with any of the software or hardware we discuss or provide examples for.
Step 1. Install the software
Simply download and install the setup.exe file first (instructions and software here) before any of my programs can run. If you have already done this for another program from this site you most likely won't have to do it again. Here's a link to the mailing list and the files needed, just download the folder, extract it and run the "setup.exe" file within it. It doesn't matter where this is saved as long as it is to the computers main hard drive (just leave everything as default). WARNING - the installation file is large (approximately 364MB)
You can download the WBB centre of pressure collection and analysis program from the following link.
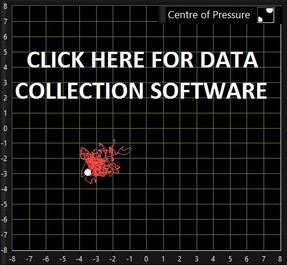
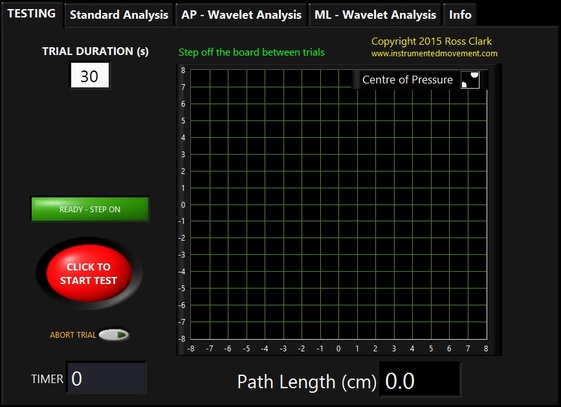
Once this is downloaded double click the file and it will extract itself. The best location to choose is your desktop, that way you will easily be able to find it. Once you have extracted it you will have a folder called "Ross Clark - WBB Sway Program". Within that folder will be a file called "Ross Clark - WBB Website Version" All you need to do is double click this and the program will open. You will see a screen that looks like this:
Step 2. Connect the Wii Balance Board
To collect data from the WBB you must first connect it. This should be done before opening the software. Follow the guide on the "Setup Instructions" for the Nintendo Wii Balance Board page of this website to find out how to do this if you haven't done it before. REMEMBER - always disconnect it at the end of the data collection session.
Step 3. Running the Program
Before starting put the WBB on a hard, flat surface. My program treats the side of the WBB that has the button with the LED on it as the posterior (back) of the force platform. If you are doing eyes open tests the most reliable data will be obtained if you place the WBB a set distance from a wall and have some form of target for the person to look at.
To run a test perform the following steps:
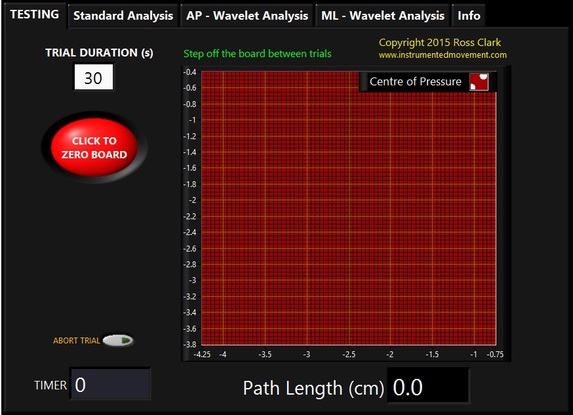
1. After you have opened the software choose the test duration. The default is 30 seconds, this can be changed to any value you prefer.
2. Prior to testing you must zero the board. With nothing on the WBB click the big red "CLICK TO ZERO BOARD" button. For the next few seconds the program will perform the zeroing, after which you will be notified that the program is ready and the person can step onto the WBB.
3. Have the person step on the WBB with their feet (or foot) in the desired testing position. Once they have stabilised click the "CLICK TO START TEST" button. This will start the timer, and the program will collect sway data until the timer reaches the trial duration. It will then automatically stop. You will know data is being recorded because a red trace will appear on the graph showing where the centre of pressure has traveled during the trial.
4. The program will take some time to analyse the data - short duration trials of 60 seconds or less will only take a couple of seconds. Once the analysis is complete the screen will flash and a path length result will appear. The results for other outcome measures are also calculated, including standard analysis methods such as range and velocity in the anterior-posterior and medial-lateral axes. These are displayed along with the filtered centre of pressure trace on the "Standard Analysis" tab.
4. The program will take some time to analyse the data - short duration trials of 60 seconds or less will only take a couple of seconds. Once the analysis is complete the screen will flash and a path length result will appear. The results for other outcome measures are also calculated, including standard analysis methods such as range and velocity in the anterior-posterior and medial-lateral axes. These are displayed along with the filtered centre of pressure trace on the "Standard Analysis" tab.
5. Additional wavelet-based measures are also calculated and graphed using spectrograms. These are shown on the "AP - Wavelet Analysis" and "ML - Wavelet Analysis" tabs. Details about how these are calculated are provided in some of our papers, including:
Liang, Z., Clark, R., Bryant, A., Quek, J., & Pua, Y. H. (2014). Neck musculature fatigue affects specific frequency bands of postural dynamics during quiet standing. Gait and Posture, 39(1), 397-403.
Clark, R. A., Howells, B., Pua, Y. H., Feller, J., Whitehead, T., & Webster, K. E. (2014). Assessment of standing balance deficits in people who have undergone anterior cruciate ligament reconstruction using traditional and modern analysis methods. Journal of Biomechanics, 47(5), 1134-1137.
Quek, J., Brauer, S. G., Clark, R., & Treleaven, J. (2014). New insights into neck-pain-related postural control using measures of signal frequency and complexity in older adults. Gait and Posture, 39(4), 1069-1073.
The easiest way to understand what these values represent is to perform a variety of different movement strategies during a balance test and observe what effect these have on the spectrogram and the independent moderate, low, very low and ultra low frequency graphs. For each of these independent graphs the red trace represents the whole signal, and the white trace is the movement in each of the independent frequency bands. Rapid movements such as twitching ankle strategies will result in movements in the moderate and low frequency bands, whereas more subtle and slow movements will only be detected in the lower frequency bands. You can also see the movements in each of these frequencies represented on the spectrograms. The colours on the graphs range from purple, indicating no activity at that time point in that frequency range through to red which means there is a high intensity of activity at that time point in that frequency range. For example, in Image 4 of the above slideshow which represents medial-lateral movement of the centre of pressure during a single leg balance test, rapid ankle twitching occurred during this test from approximately 24 to 28 seconds. This is quite pronounced in both the spectrogram and the Moderate Frequency graph, however is unnoticeable in any of the other three frequency graphs. This allows us to identify independent movement strategies that may be hidden by more common analysis methods.
6. This program will run continuously until you exit it - you can do this by simply clicking the red X in the top right of the program just like you would for any Windows program.
Troubleshooting
1. The problem 95% of the time is batteries - please only use 4 x AA batteries from a fresh packet. One tricky aspect of the WBB is that it will seem like it is connected to the computer if the batteries are weak, but will then drop out during testing or fail to be recognised by the program. If in doubt take the batteries out.
2. Always make sure you disconnect the WBB at the end of a session. Before collecting data from it you must connect it, if it is already connected but the computer has been turned off / restarted / hibernating then the connection will be lost. Disconnect it, reconnect it and you should be fine.
3. The installation software must be installed before my program can run. You will need administrator rights for this.
4. When extracting the installation software, consider extracting into a different location on your laptop. For example, if the downloaded folder is in your downloads, when extracting the files, save these into a different location, e.g. your desktop.
5. Do not have sway or strength applications open when connecting WBB using Bluetooth. Close the application, connect the WBB and then open the application again.


