Reliability and validity analysis archive
The original online calculator is no longer hosted here. The spreadsheet template and demonstration video below document its workflow; they do not perform an analysis.
Download results template (.xlsx)
Original workflow and reference material
Online calculator and plot generator for reliability and validity
The calculator below generates absolute (abs) and relative (rel) intraclass correlation coefficient (ICC) for model types 2,1 and 2,k, percentage based minimum detectable change (MDC) and standard error of the measurement (SEM) scores for two columns of data. It also generates a scatterplot with linear fit and confidence intervals, standard and linear regression based Bland and Altman plots, quartile-quartile plots, paired samples t-tests - both parametric and nonparametric (Wilcoxon), Cohen's d effect size, Levene's test of equality of variances, Shapiro-Wilk tests and histograms with normal distribution shading for the datasets.
None of your data or interactions are saved, and noone can see what you are doing other than people looking at your screen.
None of your data or interactions are saved, and noone can see what you are doing other than people looking at your screen.
****Please cite this website (www.rehabtools.org/stats.html) if you use this analysis program
Exporting to Excel
Download the .xlsx file below as a template if you want to copy and save the results of this page. Simply open the template, then for each analysis copy all of the data from the "Results - Excel Ready" box and paste it into the first column. You can also screenshot the graphs, either by a simple print screen command or preferably using something like the snippet tool in Windows.

| rehabtools_-_validity_and_reliability_headings.xlsx | |
| File Size: | 9 kb |
| File Type: | xlsx |
Paste entire spreadsheet version
Quick Text How to Guide:
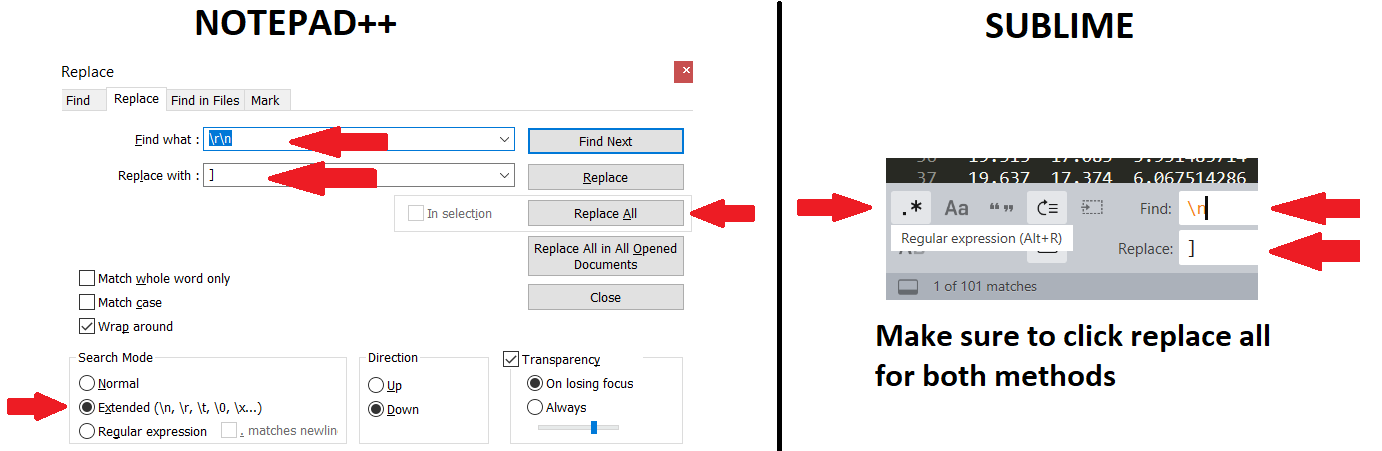
Using Notepad++ (Windows only)
Using Sublime Editor (Windows or Mac)
Follow the exact same guidelines as above, but paste into Sublime Text Editor and search for \n
Using Notepad++ (Windows only)
- Select and copy all of the data you want to analyse in your spreadsheet program
- Paste it into Notepad++ (this example is for that) or Sublime Text (works on Macs)
- Go to Search, Replace (the shortcut is CTRL+H on Windows)
- YOU MUST select "Extended" under Search Mode
- Enter the following - Find what:\r\n Replace with:]
- Choose Replace All
- Copy all of the data - which is now in a single row - and paste it into the text box on the website
- Choose the 2 rows of data to analyse based on the numbers in the grey boxes on the left of the table
- Press the green "Click to Process" button, review the results, and copy the data at the bottom and paste into your analysis spreadsheet. You can then either print the page as a pdf file or do a screen print for capturing the figures.
Using Sublime Editor (Windows or Mac)
Follow the exact same guidelines as above, but paste into Sublime Text Editor and search for \n